|
|
|
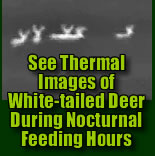
In the summer of 2006 the Agency began utilizing a relatively new and exciting technology that may have vast ramifications in the world of wildlife management. TWRA biologists recently began "experimenting" with a thermal imager and are just now developing protocols to collect more accurate and more detailed information about our wildlife populations. What is a thermal imager?
The Agency recently conducted a pilot project in Middle Tennessee which utilizes the thermal imager to determine buck/doe ratios and fawn/doe ratios on a countywide scale. Over the course of three nights biologists thoroughly covered a Middle Tennessee county and in just over eight hours of observation time, we recorded 289 deer observations. Of the observations, 215 were confirmed observations in which the deer were placed into three distinct categories: adult buck, adult doe, and fawn. The results are: 68 Adult Bucks, 101 Adult Does, 46 Fawns, (74 Unknowns) This would equate to a countywide buck-to-doe ratio of 1 to 1.48. This is probably an accurate representation of most counties in this particular vicinity. There is no doubt there are some areas that will be slightly better and some areas that will be slightly worse. However, it is a far cry from the 4:1 or 6:1 ratios that many hunters often report. The fawn-to-doe ratio for the county was 1 to 0.45, however we feel this is slightly below actual since fawns are often left unattended and not always sighted with the doe. This shows the imager's limitation in getting precise fawn recruitment, however, it is an excellent tool in getting "minimal recruitment rates". In summation, most counties in TN appear to be in great shape. The Agency will continue to utilize these new technologies to manage our wildlife populations to our utmost capabilities. |
|
|
|
||